Introduction
Wayfair sells more than 33 million products from over 23 thousand suppliers. We categorize these products into over a thousand “product classes.” Some examples of product classes include coffee tables, bathroom storage, beds, or table lamps. The Query Classifier predicts the classes of products with which customers would most likely engage, given their search queries.

The figure above illustrates how Query Classifier plays its role in search. When a customer submits a search query, the Query Classifier predicts relevant product classes. The system then uses this information to display related product filters and to boost search results of the appropriate product classes.
The Challenge
Deciphering what types of products are relevant to a search query is a difficult task. Wayfair serves millions of unique search queries every day. While a small percentage of the queries explicitly mention product type and are thus easy to classify, most of the queries do not, and we need to rely on the users’ activities to find out the intended product class. Some queries are ambiguous. For example, the query “desk bed” could refer to bunk beds with a desk underneath, or it could mean tray desks used in bed. Some queries require the system to understand both Wayfair and our competitors’ catalogs. The query “Azema dining table” may look like a dining table class query, but in fact, the customer was looking for patio dining tables. Some queries can be broad and refer to multiple classes, while others mean different things for different customers.
This isn’t the first time Wayfair Search has attempted to build a query classifier. Our previous version of the classifier, a set of logistic regression models based on n-grams, does not perform well on some of the complexities above. It could not capture the nuances and implications of the search queries beyond surface expressions. These complexities prompt us to develop a deep-learning method to solve the problem.
Our Approach
At Wayfair SearchTech, we developed the Search Interpretation Service to perform live search query understanding tasks. When a customer submits a search, the Interpretation service processes the query in several microservices to provide spelling correction, predictions of the query’s relevant classes, and so on. The outputs of the Interpretation service are then consumed by downstream Search applications to retrieve relevant products to present to the customers. The Query Classifier model powers one of these Interpretation microservices. In this article, we will focus on the offline model development part of the Query Classifier project.
Data Collection
The Query Classifier learns from historical customer behavior data. We assume that the customers generally add relevant products to their shopping cart during the search. Thus, we collect historical user search queries and the classes of the added-to-cart (ATC) products as the model development dataset. For this, we define a search experience as the sequence of customer activities after submitting a search query and before moving on to a different activity. For each search experience, we collected the search query and the classes of the ATC products. Each data point in our dataset corresponds to one unique search experience from one unique customer. Some example data points are shown below:
We collected ten months of historical behavioral data for the training set and two weeks for dev and test sets. We further refined the test set queries to only include the ones where we have historical model/user data with the aforementioned logistic regression baseline model. Here are some statistics of our datasets:
Model Details
The model needs to perform live query classification tasks within a few milliseconds during 500+ requests-per-second peak traffic. We adopted a Convolutional Neural Network (CNN) model to solve the multi-label classification problem within the inference time requirement. The model architecture is shown below.

The model input is the raw text of the customer search query. We developed a custom tokenizer that specializes in search query tokenization. No custom normalization is performed other than digits normalization. After tokenization, we pad the search query to a uniform length. We use pre-trained word embedding to initialize the embedding layer weights. We then apply a convolution layer and global max pooling. The output layer corresponds to the 931 classes from the Wayfair product taxonomy.
Evaluation
We compared the CNN-based Query Classifier against the existing logistic regression n-gram models (baseline). The baseline models are a collection of binary classifiers whose total parameter count exceeds that of the CNN model. The model performance on the test set is shown in the table below.
The CNN model showed an 18.6% relative gain in F1 compared to baseline. The F1 increases were attributed to a drastically improved recall despite a slight decline in precision. We further validated the model performance on data spanning over six months and observed consistent performance. The CNN model outperformed baseline because 1) despite having similar numbers of parameters, the CNN model shared these parameters across all classes while the baseline models didn’t; 2) the CNN model showcased better semantic understanding thanks to pre-trained embeddings and much more training data.
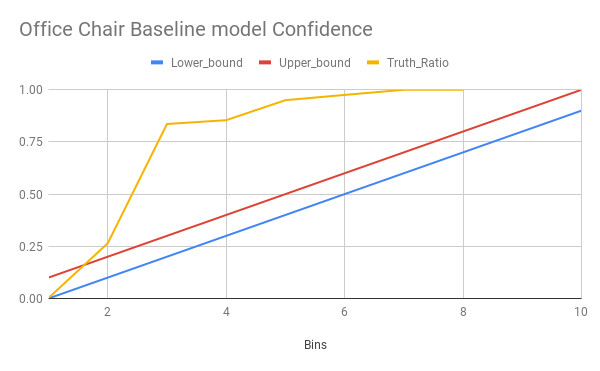
Furthermore, the CNN model is also better confidence-calibrated than the baseline model. For a classifier model to be useful, it not only needs to make accurate predictions but also needs to reliably indicate how likely it is to be correct. Guo et al. defined model confidence to be the probability of correctness [1]. For a model to be confidence-calibrated, its prediction score should approximate the probability of the prediction being true. For example, if a model makes 100 class predictions and each prediction scores 0.5, then we would expect 50% of these examples to be correct. Following Guo et al.’s method, we plot the reliability diagrams of the baseline and CNN model on the Office Chair class below. The yellow lines in the diagrams plot the model output prediction (x-axis) against the observed sample truth ratio (y-axis). If a model is well-calibrated, we would expect the model output prediction to align with the observed sample truth ratio, i.e. the yellow line should fall between the region between the diagonal red and blue lines. If the yellow line is above the red/blue boundary, it indicates that the model is underconfidence. Conversely, a yellow line below the red/blue boundary indicates an overconfidence model. In the baseline model diagram, when the model predicts that some queries’ likelihood of being Office Chair is between 0.3 - 0.4, in fact, 80% of those queries actually refer to the Office Chair class. The yellow line’s deviation from the diagonal lines indicates poor calibration. The diagrams show that the baseline model is highly under confidence while the CNN model is better calibrated.


Here are some specific examples demonstrating the improved performance. The results are shown in the format of the champion class name and corresponding confidence score.
Online Testing
We launched three online A/B tests to validate the offline model performance observation. The three tests are: 1) boosting the rankings of class-appropriate products in search results; 2) displaying class-specific filters; 3) redirecting queries with high class confidence to prebuilt class pages. We designed this phased testing approach to measure the Query Classifier’s impact on each downstream application. The results show that the improved Query Classifier had the most significant impact on the product boosting feature and the second-largest impact on the class-specific filter feature. We have since launched the Query Classifier model on our Wayfair US website to provide customers with a more relevant search experience.
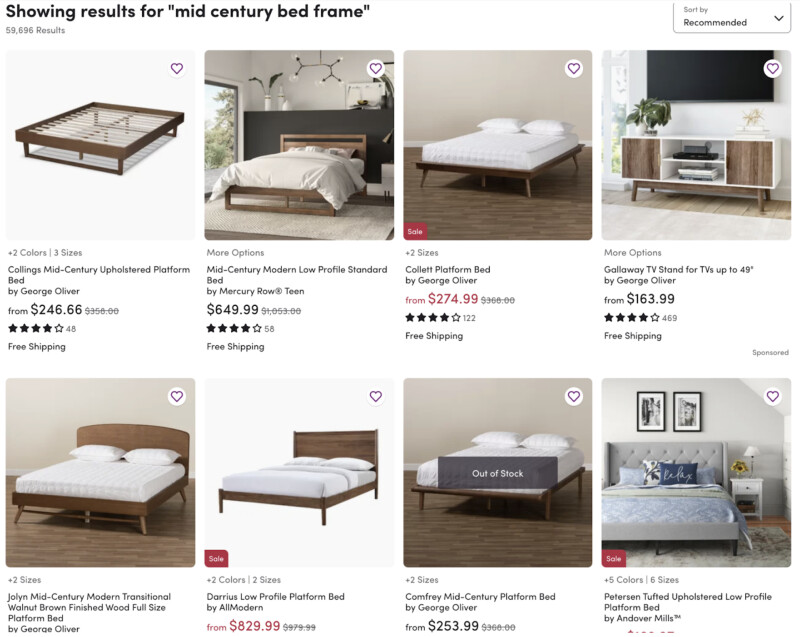
Some example screenshots of the control search results compared against the Query-Classifier-powered search results.


What's Next
The production Query Classifier only considers the search queries and leaves any customer information (e.g. customer preferences, geo location, previous shopping behavior, etc) on the table when making predictions. The same search queries may have different meanings for different customers. For example, a customer who searches for “dining table for 4” while decorating her dining room is likely looking for indoor dining tables. A customer who uses the same query after purchasing some outdoor seat cushions is more likely to be looking for patio dining tables. We are working on incorporating customer search contexts into the Query Classifier to improve our customer’s search experience further.
Acknowledgment
The success of this CNN-based Query Classifier model is a joint effort of Data Science, Engineering, Product Management, and Analytics teams from building host service for productization to read-outs on final test results. We are looking forward to working together and conquering many other challenges in the future.
References
[1] Guo, Chuan, Geoff Pleiss, Yu Sun, and Kilian Q. Weinberger. "On calibration of modern neural networks." In International Conference on Machine Learning, pp. 1321-1330. PMLR, 2017.

