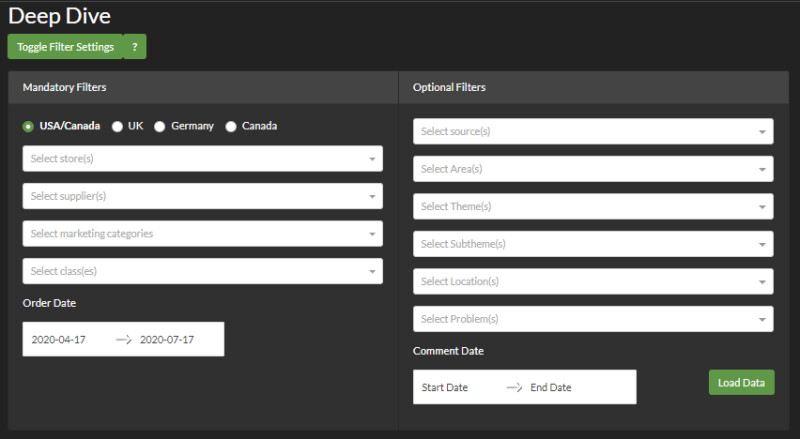
Feedback Hub is Wayfair's inhouse web application, built by Data Science Analytics, which enables Analysts all across Wayfair to leverage data and insights generated by Natural Language Models developed by our Voice of the Customer DS team.
One Feedback Hub for (almost) all customer feedback analytics
Wayfair receives a vast amount of customer feedback on a daily basis as unstructured data, like review comments, return & incident notes, product questions or survey results. With a daily volume of more than 50k comments, this data provides a canvas for business analysts to identify opportunities to further optimize our business. Analysts are interested in understanding 1) what and 2) with which sentiment customers speak about our products and services. Our Data Science team developed two models: BRAGI (a BERT based model to classify unstructured text data), and ExtRA (an unsupervised sentiment and topic extractor). These models combined allow us to process all of our customer feedback at scale and enable our business analysts in various departments to generate deeper insights faster than before.
After these models were successfully baked into micro services and production workflows the next step was to enable analysts to explore model outputs to derive actionable insights from. We wanted to make sure that multiple workflows are supported, which needed a greater amount of flexibility.

A typical analysis could look like this:
| 
|

|
While exploring the usual suspects like Tableau, Data Studio or Looker we quickly realized that they could support filtering and analysis, but were unable to call our ExtRA model service ad hoc. As pre-generation of topics extractions for all the different data slices deemed not appropriate we decided to explore different options. This led us to the Python Dash, an open source framework from the founders of plotly.
Python Dash is built on top of Python flask, react.js and plotly.js making it a perfect match for highly customizable visualization and workflows written in pure Python (You can check out this
App Gallery to get more excited). In addition it supports easy deployments on kubernetes and REDIS caching for big data. Plus, as it is web based, you can easily integrate frameworks like Google Analytics to track usage and explore workflows Analysts run most frequently. You do not need much to
get started, although some experience in Python, app design, HTML and css will come in handy.
Quite some lift which comes with learnings
Before diving directly into the app development here are some recommendations to scope effort and plan your work when tackling a similar problem:
- Use docker right from the startAlthough it might be tempting to explore Dash directly or from jupyter notebooks) it will save you some time you can better spend on managing dependencies and for deployment on kubernetes.
- Dash Callbacks are your best friendsBecome an expert in Python Dash Callbacks as early as possible. These are Python functions that are automatically called by Dash whenever an input component's property changes - you can envision it similar to excel - as soon as a component (cell) is changed, the callback and their underlying functions are executed to update the app itself. If you are app will only need a submit button this is rather simple, but for more complex workflows account for enough development time to avoid Spaghetti code going forward. In our use case, we have callbacks on our filters that will parametrize the data queries, decide to use cached data or pull from the database and update the visualisations accordingly.
- UI design can waitDo not spend too much time on the UI design at the beginning. Python Dash supports the HTML, JS and CSS bootstrap framework that can be easily customized using bootswatch. We ended up selecting an available design there, copied it and made color adjustments creating our own bootswatch theme.
- May the force of Python be with youUse the power of the python library universe, e.g. start building unit tests and documentation right from the beginning and build mocks for functionality that might not be available in your development environment.
When it comes to the deployment the steps to take are of course highly dependent on your infrastructure and processes available. Here at Wayfair a dedicated Python development team provided a lot of helpful libraries for logging, monitoring and database connection management. In combination with
buildkite,
artifactory and
Continuous Deployment deployments to update our app is way less work then it used to be. It is worthwhile calling out you should plan for an extended deployment time if this is your first kind of it type app in your company.
Finally - the architecture
On a high level, this what the architecture we ended up with:

In a nutshell, we recommend exploring Jupyter Dash in case you need non standard data visualisations along with interactive features and/or you want to quickly build an UI interface for your models in a production ready and scalable way. If you want to avoid engineering overhead as much as possible and are looking for more prototype workflows, you can start exploring existing frameworks in this article.
