The App Platforms Team at Wayfair, empowering a team of more than 60 mobile developers with efficient tooling and processes, has been actively looking at the performance of it’s mobile offerings, turning this into more focused work in the past few months. We wanted to involve as many of the brilliant minds working at Wayfair as possible to understand the question around performance, and to find concrete solutions.
For the team, the question has become: “How can we make the improvement of the performance of the app tangible and motivating for every software engineer, project manager, designer and QA tester?” Without the active participation of these groups, it would be impossible to create impact. Therefore, we wanted a tool that would convey information about performance to anyone, without requiring them to have a technical background. At the same time, we needed this hypothetical tool to provide technical details to ensure engineers have all the information they need to fix performance issues.
TL;DR: Teams working on performance for the Wayfair website suggests that we look into a project called Open Tracing. It describes a way of analyzing and tracking the workload occurring during a certain period of time in a program. We realized that it would fit our requirements for a great performance tool, but it was unfortunately not available for mobile devices. We decided to use an implementation of Open Tracing developed at Uber called Jaeger and write native code for iOS to add in compatibility with their tool.
Before presenting any technical information about Open Tracing and describing our journey to bring this tool to iOS, let us take a look at how we used it for the first time at Wayfair.
Case Study: The Category Page in the Wayfair iOS App
Our team, who works on Category pages, agreed to be the first to trial our compatibility layer for Jaeger on iOS. The Category section of the app is composed of a long list of category names that will redirect the user to a list of products organized under a specific category, or, it will redirect them to a list of subcategories. It also has an infinite scrolling list of suggested products at the bottom of the page (see video below). Navigating through different subcategories felt really slow, since we had to wait a long time when loading different pages. The Category team wanted to find a way to improve performance on this page.
As you can see in the before-and-after video, the team did an excellent job at improving the speed of their page.
What can Jaeger tell us about this change? Jaeger enables us to measure the time needed to execute specific parts of our code by creating blocks of work called spans. In the Jaeger web interface we can see the name, the start time, the end time, and how long every span took to execute. These spans can have a parent/child relationship to each other, represented by the nested arrows on the left.

By looking at the preceding image, called a trace, we can observe the following:
- It takes 0.14 seconds to gather information from the network about the categories shown on the page.
- It takes an extra 0.35 seconds to complete the push animation.
- After 0.55 seconds, the page is ready for user interaction.
- At the same time the push animation starts, the device fetches information about different products in our inventory that will be displayed at the bottom of the page.
This graph depicts the improved version of this page. On the prior, unoptimized version of this page, we must wait for both network calls before displaying the categories. With this graph, we observe that it went from a 1.5-second waiting period, without being able to interact with the page, to a 0.5-second waiting period. This is an improvement of 300%!
With this straightforward analysis, we understand the complete loading flow of the category page and all the improvements that were made to it before the page was optimized. This has enabled us to identify where our attention should be spent on future improvements; in our case, we would see the greatest returns by improving the time elapsed (1.37s) to load products on the page.
Here are some questions that arose after looking at the previous trace:
- Should the products be on that page at all?
- Should the product be loaded only when the user scrolls to the bottom of the page?
- Should fewer products be loaded at first, in order to make the request faster?
- Is too much information loaded in the network request?
These questions were asked and addressed by people with different roles in our team: Software engineers, project managers, designers, and the QA team. It is specifically the way that Jaeger visualizes these results that enables input from various members of the team, despite their role or technical skill.
With Jaeger, we empowered our engineers to quickly explore and gather data related to all of the questions above. Below is an example where we asked ourselves: “What would happen if we removed all animations and deleted the product list from the page?”
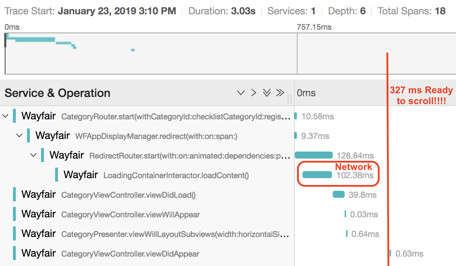
We now know that it results in a 0.2 second gain. Maybe this observation will lead to a different animation in the future? The bottom line is that we now have a way to gather data to inform our next moves and investigations.
The last observation made during this investigation (see Figure 1) shows that the loading spinner was present during half of the push animation. It was giving an impression of slowness, even in a fast-loading page. Our goal is to explore options to improve this perceived performance, such as showing the spinner only after a certain waiting period. We will also ask our Design team for a bit of help.
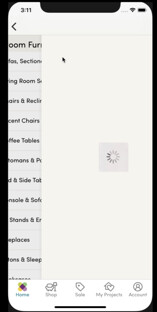
Once again, Jaeger is giving us concrete numbers, not only on performance, but also on perceived performance. It has fundamentally changed how we discuss improving the overall performance of the app.
Some Definitions
First, what is the difference between Open Tracing and Jaeger? Open Tracing is a set of ideas describing how to track and understand the work being executed in a program, or multiple programs, across a distributed system. In other words, it lets us follow a span as it travels across a complex, multi-device system with many components. In addition, each component can be written using a different programming language.
In contrast, Jaeger is a concrete implementation of the Open Tracing idea. It was developed at Uber with implementations for Go, Java, Node.js, Python, C++, and C#.
Let us now take a look at the most important concepts introduced by Open Tracing and Jaeger before exploring our implementation.
Open Tracing
We have already seen that a span represents a unit of work and that a collection of spans is called a trace. More precisely, a trace is a directed acyclic graph, where the nodes are the spans, and the edges are the relationships between them. These spans will contain important information such as:
- Their name
- Their start and end time
- A dictionary (where each key is a string) of additional data called tags
- A list of logs represented by a time-stamped tag
- Their relationships
Here is an example of the Jaeger user interface (Jaeger UI) showing statistics to the user:

Open Tracing also brings about the notion of a tracer. As explained in the official documentation, it should be able to create spans and serialize/deserialize them across system boundaries. Most of the time this means that it propagates the spans over the network.
We are voluntarily omitting a considerable part of the official documentation, but the previous definitions will be sufficient to understand our work on Jaeger iOS.
Jaeger
Jaeger has added three extra parts to this equation when crystalizing the abstract concepts of Open Tracing. The first is named the agent, and it is responsible for collecting spans sent by the tracer and reporting them to a collector. An agent will encapsulate the logic to cache the spans and create batches before transferring them. The collector will ingest the spans sent by an agent and save them. The Jaeger UI Service will be able to query this data at a later time to display to the user.
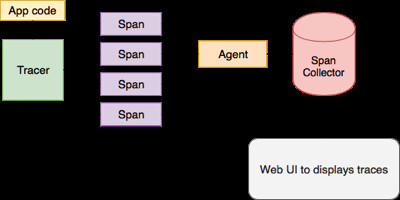
We will explore our custom variant of this system in the next section and give more details on how each part transmits data to the other.
Implementing Open Tracing for iOS
With all of the definitions above, we are ready to understand the most crucial pieces in our quest to idiomatically implement Jaeger for iOS.
We started our journey by investigating Jaeger’s usage of an interface definition language (IDL) and a binary communication protocol (BCP) called
Apache Thrift. It is used to both define and send data between the tracer, the agent, and the collector.
Decoupling from Apache Thrift
The IDL component of Thrift can be observed in the contents of a Thrift file. It can be conceptualized as a list of definitions of objects and class interfaces formed with a few primitive types. It can be parsed with a tool to be rewritten in any Thrift supported languages: C++, Java, Python, PHP, Ruby, Erlang, Perl, Haskell, C#, Cocoa, JavaScript, Node.js, Smalltalk, OCaml and Delphi. Here are some lines of the Thrift file defining a
span.
struct Span { 1: required i64 traceIdLow 2: required i64 traceIdHigh 3: required i64 spanId 4: required i64 parentSpanId 5: required string operationName … 7: required i32 flags 8: required i64 startTime …}We quickly realized that this representation of a span was forcing us to use a limited set of types enforced by Thrift. The limitations of Thrift’s specification prevented us from creating a direct translation in Swift that suited the idioms of the Swift language. This motivated us to implement the concepts of a span and tracer without considering the details of a Jaeger implementation, but by first focusing on modeling the Open Tracing definitions.
For example, we are using a 128-bit UUID instead of two Int64 (as required by Thrift) to represent unique numbers. Furthermore, we are taking advantage of the Date type instead of an Int64 to represent time. It presents a more accurate and idiomatic representation of the data to Swift developers, without deviating from the specification. In addition, we created custom types to help represent the different concepts of a span. Span.Context is one such example. It is used to pass a reference from one span to another without having to keep a reference to an Int64 identifier. It provides a lot more context and type safety in addition to improving the clarity of our code. Take a look at our full definition of a
span in our documentation.
struct Span { … private let tracer: Tracer public let spanRef: Span.Context public let parentSpanId: UUID public let operationName: String public let startTime: Date public private(set) var endTime: Date …}In addition, we created a compatible span type on top of this standard type called JaegerSpan. This type conforms to the standard Thrift definition accepted by the collector during network communication, and is easily convertible from a span using a custom initializer. Using this pattern, we were able to implement the Open Tracing specification and the Jaeger specification in full, and maintain compatibility without restricting ourselves to a single specification.
The Tracer, The Agent, The Sender and The Collector: A Lovely Story!
After taking the preceding into account, we had to ensure that our implementation scaled within the context of a mobile application, rather than a website or some other resource-rich server-side application. We realized that the agent had to be running in our application, since we needed to intelligently batch our spans together before sending them out of our mobile application. The main purpose here was to minimize the number of network calls made when using Jaeger. As a positive side effect, we gain full control over our caching mechanism in an effort to minimize CPU and memory overhead of Jaeger on our apps. We created the following services to achieve our goal: Tracer, agent, sender and mediator.
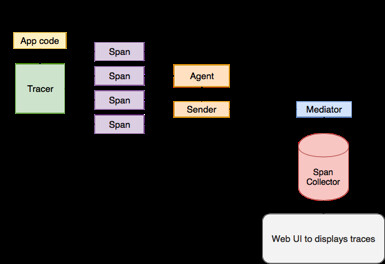
We decided that our tracer would only be able to create Open Tracing spans and be dependent on an agent instead of having its own networking capabilities. When a span is completed, the tracer will forward it to the agent. Subsequently, the agent will save the spans to disk (using core data) and send them at regular intervals. The agent will use a class called the sender that contains all the network logic to send the spans to the collector (written by the Jaeger team). Before sending the spans, the sender will convert them into JaegerSpans.
Sending JaegerSpans
In order to have our JaegerSpans interoperate with a larger Open Tracing system, they eventually need to be re-encoded as binary Apache Thrift. This re-encoding doesn’t necessarily need to happen on a device — our solution is a server-side mediator which utilizes an existing server-side Jaeger implementation.
Accepting spans encoded in the JSON format via a standard HTTP POST request, a simple Node.js application performs a one-to-one mapping of a JSON span to a Thrift span and re-transmits using the Thrift Binary Protocol to the Jaeger collector. This service is available on our repository.
Our Wayfair Operations Center Team at Wayfair deployed a similar service in our infrastructure, but this time written in Python. It enables us to send JSON data to an endpoint, allowing language-agnostic span ingestion into Jaeger. Now everyone at Wayfair has the ability to access the Jaeger UI to visualize spans in real time!
The choice of not implementing the Thrift binary communication allowed us to move faster. It explains why we have a first version of Jaeger ready to improve our application.
Do It Yourself: The Tracer, The Agent and The Sender
Our Jaeger library was designed by hiding the implementation details of the tracer, the agent and the sender behind protocols. This way, it is easy to replace any part with a new implementation and improve the current library. Here are some of the possible customizations we’ve considered:
- Create a new sender type to support Thrift Binary Protocol and remove the need for a mediator
- A lightweight agent type that doesn’t leverage core data
- Support for another tracing implementation, like Zipkin
If you have something you want in Jaeger, either among the above or something specifically for your use-case, we happily welcome any issues and/or pull requests you may have.
Conclusion of Our Journey
In the preceding sections, we saw that our engineering decisions led to an unconventional implementation of Jaeger with considerable positive gain. We have type-safe definitions of the Open Tracing concepts and an extensible library ready to be improved every day! We are proud of the work we’ve accomplished and how it has already helped to improve our app.
Finally, Some Code
How do we use Jaeger in our code base? We choose to wrap the Jaeger tracer in a class to simplify the API embedding, with specifics about the Wayfair app remaining unchanged. Here is a look at our custom tracer protocol:
public protocol OpenTracingTracer: class { func startSpan(callerName: String, callerFunction: String, parent: TrackingSpan?) -> TrackingSpan …} extension OpenTracingTracer{ public func start<Caller>(callerType: Caller.Type, callerFunction: String= #function, parent: TrackingSpan? = nil) -> TrackingSpan { let callerName = String(describing: callerType) return startSpan(callerName: callerName, callerFunction: callerFunction, parent: parent) }}public final class NoopOpenTracingTracker: OpenTracingTracer{ public init() {} public func startSpan(callerName: String, callerFunction: String, parent: TrackingSpan?) -> TrackingSpan{ return TrackingSpan() }}To clarify the previous code, below is the definition of our TrackingSpan. It is again a simple wrapper for the Jaeger span, called OTSpan. It allows us to control what functionality of the Jager library we wish to expose. It also represents a no-operation span when the internal OTSpan is not set (used for the no-operation tracer).
public final class TrackingSpan { let span: OTSpan? init(span: OTSpan) { self.span = span} public init() { span = nil} public func finish() { span?.finish() } ….}It is now easy to create a span! Here is how we can measure the time spent in our ApplicationDelegate at startup:
func application(_application:, willFinishLaunchingWithOptions: ) -> Bool{ let startAppSpan = openTracing.start(callerType: ApplicationDelegate.self) … startAppSpan.finish() return result }This will automatically produce a span named as follows:
“ApplicationDelegate.application(application: willFinishLaunchingWithOptions)”
When needed, the “start” function accepts an extra span as a parameter in order to create a parent/child relationship. In two lines of code we obtained precious statistics about the startup process of the app. It suffices to add child spans to understand each subpart of the launch sequence.
Bonus: Xcode Instruments and Jaeger
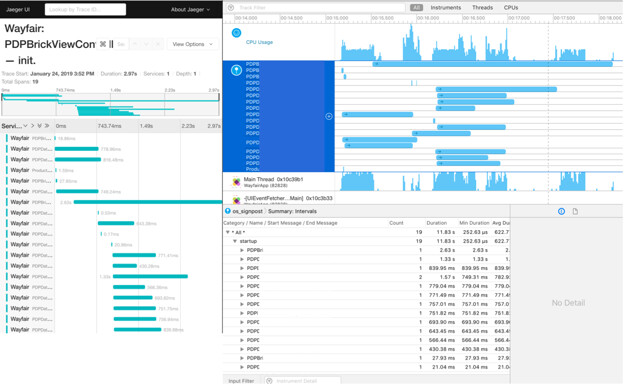
If you’re an iOS engineer with experience troubleshooting performance, you may have noticed something as you read through the preceding explanation of Jaeger for iOS: From the perspective of the client code, measuring performance with Jaeger spans is quite similar to measuring performance with Apple’s relatively new os_signpost API. Both APIs involve bracketing the code to be measured with some form of “start” and “stop” calls.
There are some differences between the two systems that need to be reconciled, but we thought it was worth investigating whether the work we did instrumenting our code for Open Tracing could be easily leveraged to integrate with `os_signpost` and Instruments.app as well.
It is pretty straightforward to find the common API surface between these two systems. The biggest difference is that `os_signpost` requires every signpost `name` to be a `StaticString` (ie. a string literal), presumably for performance reasons. If we’re willing to give up the ability to pass a dynamic `String` to Jaeger, we can write a single function that emits both a Jaeger span and an `os_signpost` in one call. That function has this signature:
func startSpan(spanName: StaticString, tagData: String?, parent: TrackingSpan?) -> TrackingSpan
A Jaeger `TrackingSpan` already has the notion of `finish()`ing the span, as described above — we just need to ensure that a `TrackingSpan` which is also associated with a signpost, also knows how to clean up that signpost. We do this by passing an optional `onFinish` closure to the TrackingSpan, which is called at cleanup time.
With this technique, we can carefully place span boundaries in our app code to measure exactly what we want to measure, and those measurements appear both in the Jaeger UI as well as in Apple’s Signposts instrument. We’ve found that while Open Tracing has obvious benefits due to its distributed nature, Instruments.app is often more immediate for developers who wish to monitor performance while doing local development. In addition, other lanes in Instruments.app can be used alongside the Signposts instrument to correlate, for example, CPU usage with the borders of the spans we’ve placed.
Thank You!
If you made it this far, thank you! I simply hope you will remember the following two ideas. First, Open Tracing is useful to convey a summary of what is happening in your code. Second, that you can learn about and improve your code fairly easily.
Happy coding and performance improving!
A big thank you to: Adi Ravikumar, J.D. Healy, Evan Mitchell, Jay Barker, Thomas Catterall, Mark Penny, Cris Concepcion, Michael DeMaso, Peter Cheung, David Kormushoff, Kevin Lustgarten, Richard Laskey, Anne Dickinson Meltz, Vadim Lozko, Sean Scalabrini, Natali Vlatko, Ben Roberts, and everyone who helped and supported our efforts.

